
Rather than the monthly average, ever wonder what the typical weather is for a given day in a month?
Using Python, I present the statistical mean values for the temperature, rain fall, wind speed, and cloud cover data in Okinawa for each day in each month of the year. Let’s see the results first!

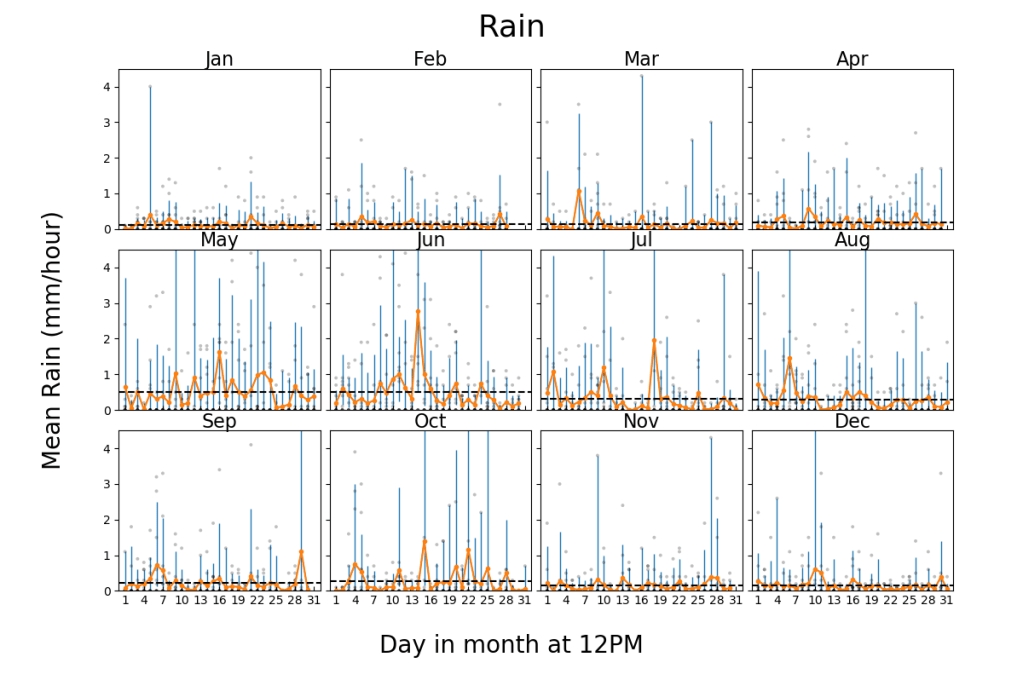
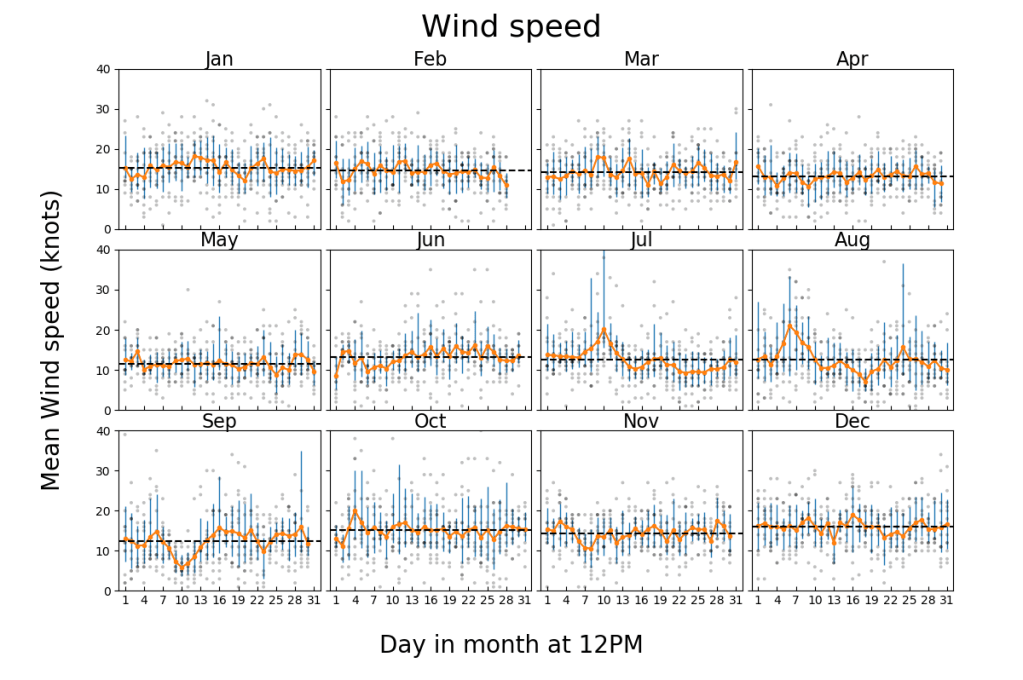
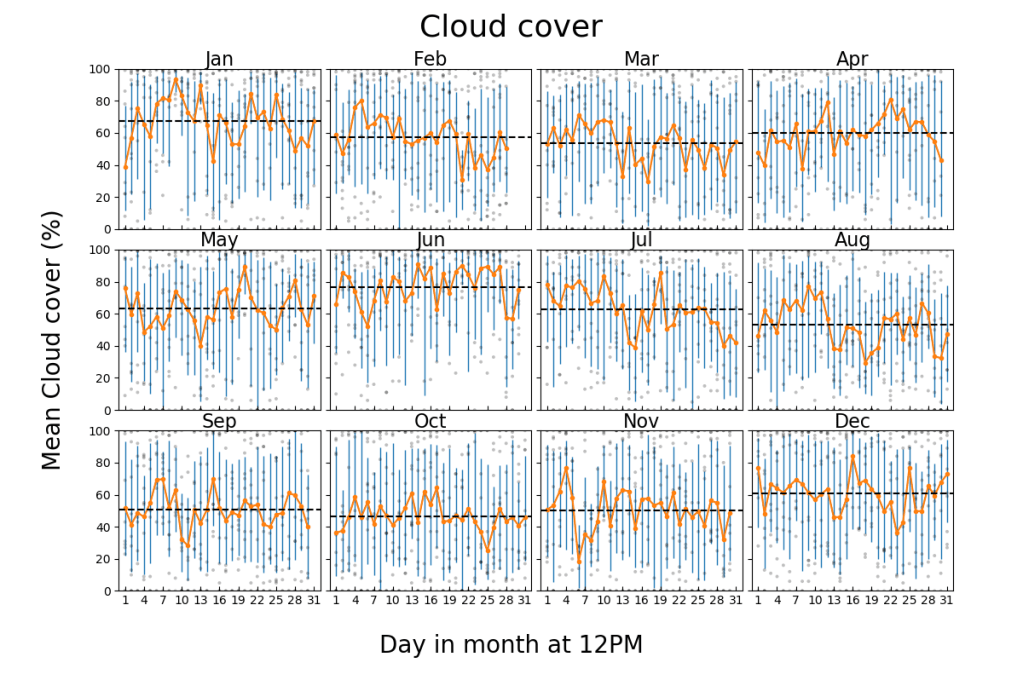
There you have it folks!
How It’s Made
Here is the procedure to make the above figures in Python
- Copy daily archive data for the given location from https://www.windguru.cz/archive.php
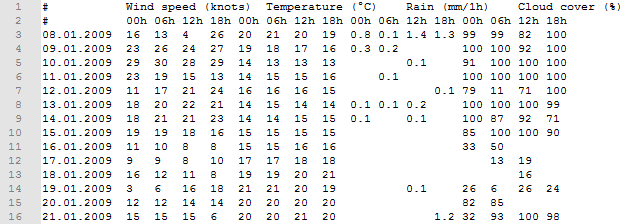
- Save it it in a text file, it will looks something like this:
3. Get the date column by: np.genfromtxt(file, usecols=0,converters = {0: str2date},comments='#') where str2date = lambda x: datetime.strptime(x.decode("utf-8"), '%d.%m.%Y') is used to decode the string to a datetime structure.
4. Read the rest of the columns by: np.genfromtxt(file,usecols=range(1,17), delimiter="\t",filling_values=0,comments='#') where the missing values are set to 0 (mostly applies to rain data)
5. Extract all the data for a given day of a given month for every year, e.g. temperature on 09/01/2009~2020. See getsubdata(DATA,month,period) in the code.
6. Calculate the mean value (in other words, the average or expected value)
7. Calculate the bounds about the mean value (by taking the average of the values that are greater than the mean for the upper bound and lower than the mean for the lower bound). This approach was used rather than standard deviation since there are few data and data like cloud cover, which is bound between 0% and 100%, does not follow a Gaussian distribution.
8. Plot the results in an aesthetic way (see GitHub code).

Also my YouTube channel for AI related projects.
